Introduction
Modern Energy has developed a model for assessing the feasibility of wind projects where no on-site wind measurements are available (called ME-WAM). This section contains a description of the numerical method, followed by a comprehensive model validation against 80 meteorological mast measurements and over 300 wind turbine locations.
The validation confirms that high accuracy and low uncertainty can be archived using ME-WAM. The average deviation between model prediction and mast measurement was found to be below 0.1m/s and the total uncertainty approximately 0.3m/s (or about 4%). This is on the same order of magnitude as that typically achieved in a state-of-the-art analysis with an on-site measurement present.
Description of Wind Assessment Model (ME-WAM)
The ME-WAM model is based on a combination of numerical weather simulations, computational fluid dynamics and in-house methods to estimate the local wind resource. The typical application for ME-WAM is either for green-field screening, merit order and market analysis, or as an early assessment of project feasibility for investment/divestment.
The mesoscale wind regime is calculated using numerical weather simulations which is conducted in the Weather Research and Forecasting model (WRF). The WRF model is a state-of-the-art weather model which is widely used in both industry and the research environment. It is a comprehensive model which includes all relevant processes of heat, mass and momentum transfer, and can be used for simulating a wide range of weather phenomena from large synoptic scales down to meso- and even microscale. The WRF calculations are conducted for one year at 1.5km spatial resolution. The high-resolution results are then long term corrected against 20 years of ERA5 reanalysis data.

Figure 1: Wind data from WRF (background map) is downscaled using WindSim (high resolution map) to achieve an accurate wind resource map for further analysis.
Modern Energy utilize the commercial CFD software WindSim to perform CFD downscaling of the simulated mesoscale wind regime from the WRF model, see figure 1. This is an important step to accurately account for microscale terrain and forest effects in the local wind prediction. The most crucial step in the downscaling process is to make the transfer of data between the models at a location which is well represented by the WRF model. Modern Energy has developed an internal method to find the most appropriate location based on the terrain representation in the CFD model and WRF.
WindSim is also used to produce wind resource maps at various height, as well as 2D fields for wind shear coefficient, turbulence and vertical inflow angle on 16 x 16 sq. km surface covering the investigate site, see figure 2. This enables wind resource assessment, layout optimization and site suitability assessment.
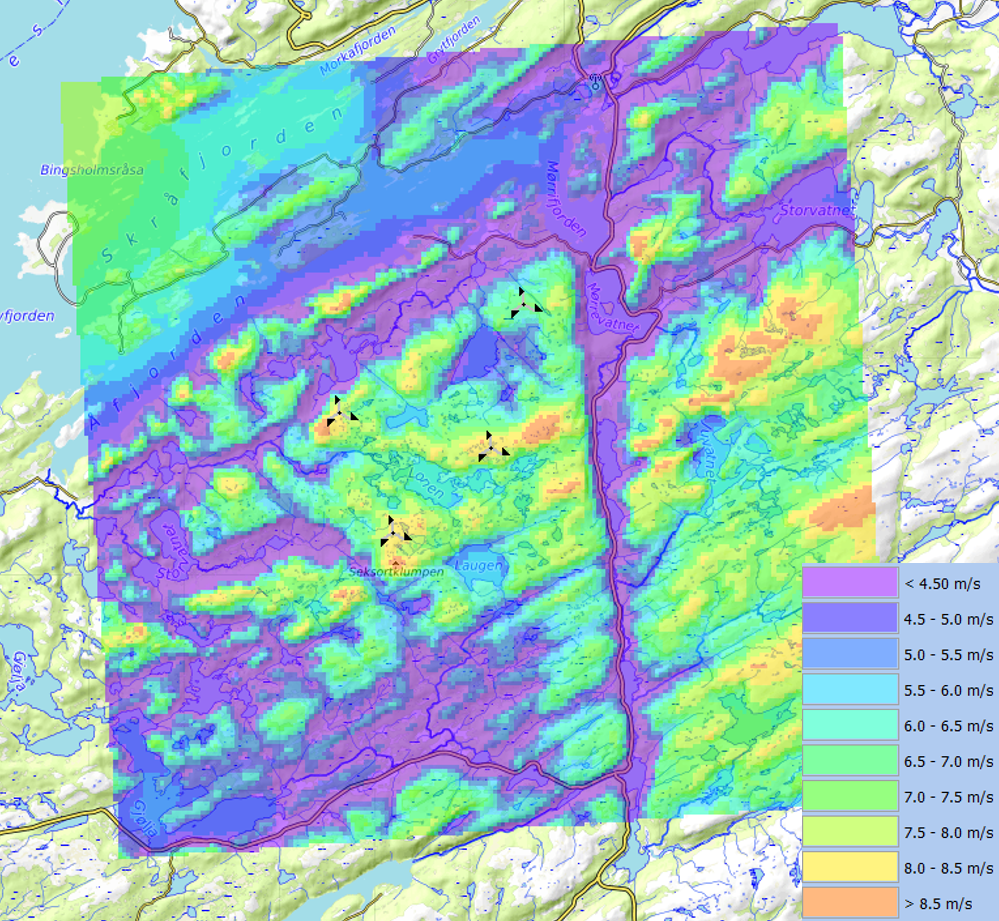
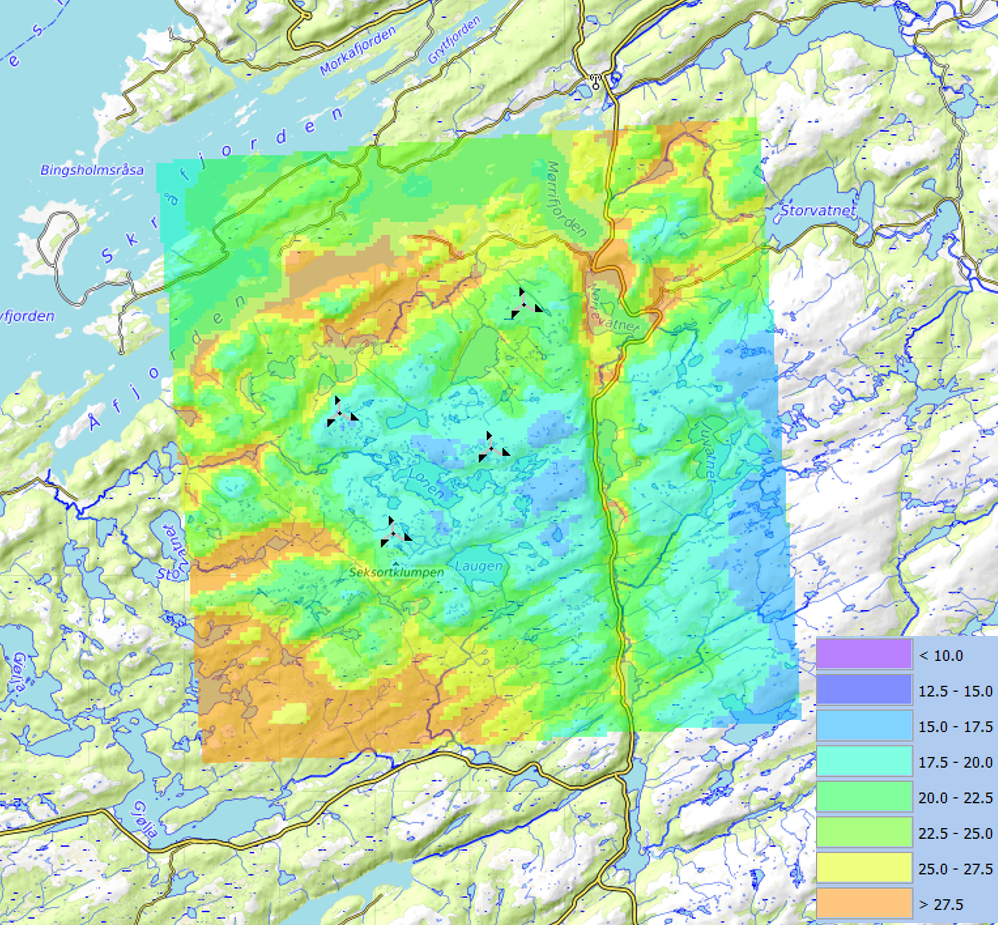

Figure 2: A wind resource map (left), turbulence map (middle) and wind-shear coefficient map (right) produced by our numerical method in complex terrain.
Description of validation data and method
The model validation consists of two steps. First the ability to predict the mean wind speed, turbulence and wind shear for a range of projects are evaluated against data from 80 meteorological masts distributed over Norway and Sweden. Secondly, a validation of the spatial variability of the wind resource over the investigated site areas is performed against state-of-the-art wind resource analyses (including high-resolution CFD and on-site measurements) from seven projects. This is an important analysis to verify that the wind resource maps produced by the ME-WAM model captures the dynamics of the investigated sites and is sufficiently accurate for initial layout optimization.
The validation data consist of 80 meteorological masts and seven state-of-the-art analyses (311 turbine locations in total) distributed over Norway and Sweden. It includes sites with severely complex terrain on the Norwegian coast as well as forested inland sites in Sweden, see figure 3. The main part of the model validation has been conducted as a blind-test by Statkraft. In this process Statkraft has provided project coordinates, Modern Energy has produced numerical results (as shown in figure 2), and Statkraft has compared the numerical results to the described validation data. Data from an additional 30 meteorological masts and one state-of-the-art analysis have also been included in the validation by Modern Energy. These data have been provided by Vattenfall, OX2, Rabbalshede Kraft and Eolus Vind.
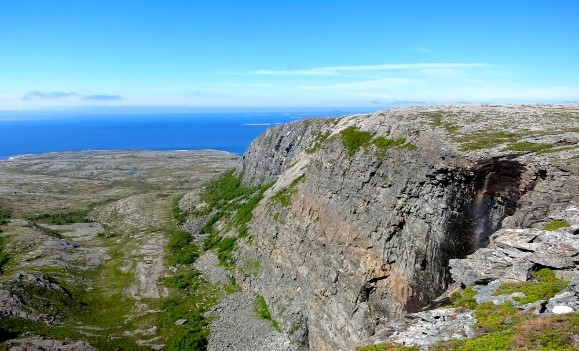
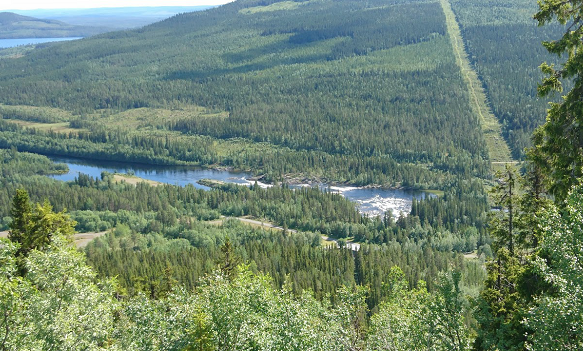
Figure 3: Shows the variations of terrain and roughness covered in the validation dataset. The left figure depicts a site in complex terrain on the Norwegian west coast and the right figure a forested inland site in Sweden.
Validation against meteorological mast data
Overall, the ME-WAM model captures the mean wind speed at the investigates site well, see figure 4. The average wind speed was found to be 0.05m/s lower than the reference sources with a standard deviation of 0.28m/s for sample of 80 meteorological masts. If the data is binned based on terrain class, we can also note that the model performs slightly better in the forested and non-complex sites (black and blue markers in figure 4), where the standard deviation only 0.21m/s for a sample of 52 data points. The corresponding number for the 28 data points in complex terrain is 0.35m/s.
Fair agreement is also achieved in terms of turbulence and wind shear. See figure 5 and 6. The 90th percentile of turbulence intensity at 15m/s was found to be 0.1 percentage-point lower than the site measurements with a standard deviation of 1.7 percentage-points for a sample of 32 meteorological masts. The agreement between simulated and measured data is relatively constant for all tested data points.
The average wind shear coefficient was found to be 0.007 lower than the site measurements with a standard deviation of 0.034 for a sample of 29 meteorological masts. A clear trend in the validation data in terms of wind shear is that the model is more accurate at meteorological masts of 100m or higher in complex terrain and in forested locations (where all masts are at least 100m). The standard deviation for that subset of data is 0.022, compared to 0.040 for the lower masts in complex terrain.


Figure 4: comparison of simulated wind speed (y-axis) and measured wind speed at the meteorological mast (x-axis).
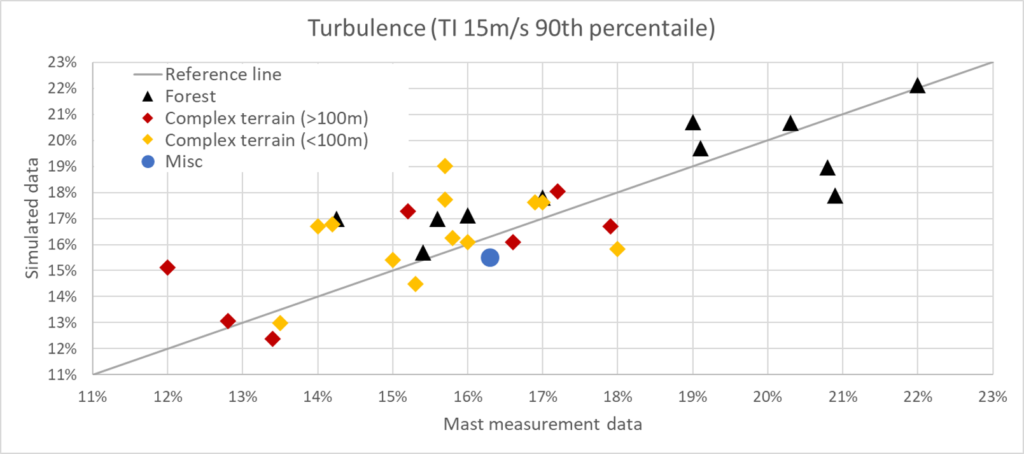
Figure 5: comparison of simulated turbulence (y-axis) and measured turbulence at the meteorological mast (x-axis).
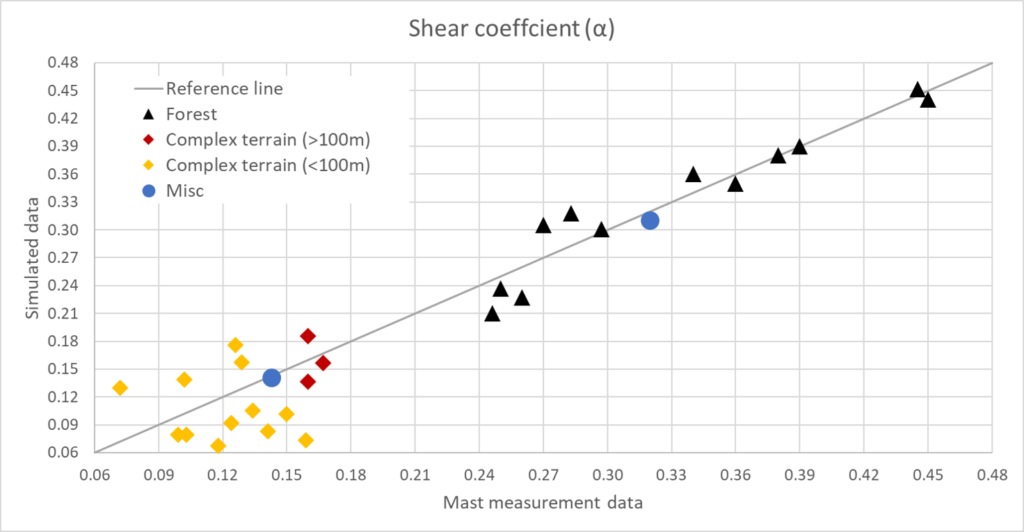
Figure 6: comparison of simulated wind shear (y-axis) and measured wind shear at the meteorological mast (x-axis).
Validation against state-of-the-art wind resource analyses
The first part of the validation quantifies the variability of mean wind speed at the individual turbine locations. To facilitate this analysis, the data is bias-corrected (i.e. the average bias for each site is removed from the data) and divided into 19 bins based on the remaining difference in mean wind speed at the individual turbine locations for all sites, see figure 7. The remaining variability is quantified as the standard deviation of the difference in wind speed between the numerical method and the full analyses. The standard deviation is found to be 0.275m/s (or about 3.5% of mean wind speed). To illustrate that the resulting variability closely follows a Gaussian distribution, a reference distribution with the correct standard deviation is included in figure 7.
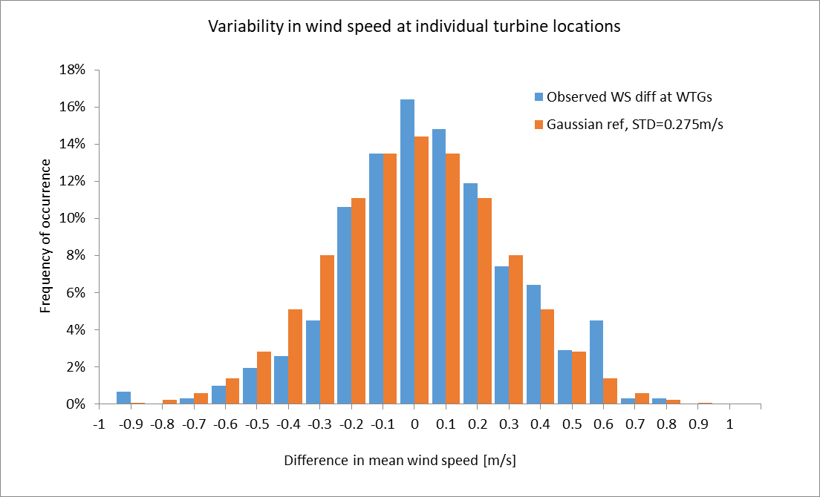
Figure 7: histogram of the bias-corrected difference in wind speed between ME-WAM and corresponding full analysis including a CFD analysis and on-site measurements at the 311 individual turbine locations over the seven investigated sites (blue bars). A reference Gaussian distribution with a standard deviation of 0.275m/s (orange bars) is also included to illustrate the Gaussianity of the observation data.
The second part of the validation is aimed at investigating if the differences in wind speed at the individual turbine locations are correlated with absolute wind speed level and/or the average bias of the sites. Figure 8 shows part of the validation effort. It depicts the wind speed of the individual turbines as calculated by ME-WAM (y-axis) and the full analyses (x-axis) for three of the projects. The three projects have different degree of absolute wind speed and average predictions bias. The figure shows that there is no apparent correlation between either average bias or the absolute wind speed at the investigated turbine locations. This finding is consistent throughout the investigation.
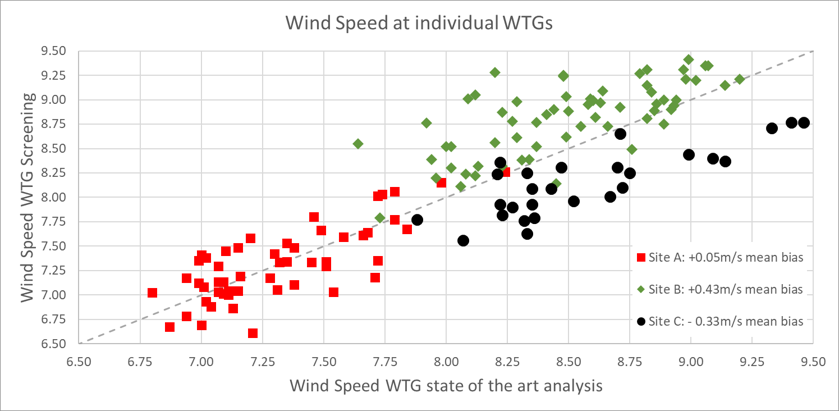
Figure 8: comparison of simulated wind speed (y-axis) and measured wind speed (x-axis) at the at the individual turbine locations for three investigated sites.
Conclusions
The presented model validation shows that high accuracy and low uncertainty can be archived using ME-WAM. The total uncertainty in the wind speed estimates was found to be approximately 0.3m/s (or about 4%). This is on the same order of magnitude as that typically achieved in a state-of-the-art analysis with a site measurement present.
The validation also shows that the spatial distinction of wind speed does not include a detectable bias for high and low wind speed locations within the tested wind farms. As a consequence, the produced wind resource maps can be used directly for initial layout optimization.
Furthermore, the agreement achieved in terms of wind speed, turbulence and wind shear is considered sufficiently accurate to use the results for initial site suitability assessment. This is an important aspect to accurately evaluate the value of a site, as turbine suitability drastically influence the potential production at a given wind resource.
As ME-WAM has proven achieve such high accuracy, it has great potential to be used for wind resource assessment. ME-WAM is about 100 times faster and less expensive than using conventional site measurements, which enables a wind power developer to analyze a much large number of projects and thereby increase the chances of discovering the best available sites.
More information is available in our published research paper available here: https://wes.copernicus.org/articles/5/997/2020/wes-5-997-2020.html