Modern Energy has developed and validated a numerical Wind Assessment Model (ME-WAM) which can analyze the potential of a wind power project without using site measurements. ME-WAM is about 100 times faster and less expensive compared to conventional project development based on measurements. This makes it possible to evaluate more projects and thereby select the best available candidates for investment or further development.
Key highlights to illustrate the benefits of ME-WAM:
- Fast and inexpensive
For the cost of a single meteorological mast, we can investigate 100 projects spread out over an area the size of Sweden within 8 to 12 weeks. - Validated high accuracy
ME-WAM predictions have similar accuracy as that expected from a full state-of-the-art analysis including on-site measurements. - No input data required
The customer only need to provide project coordinates, all other data required is open source. This means complete markets, third party projects, and even existing wind farms can be evaluated. - ”Ready-to-use” model output
ME-WAM produces wind resource maps, as well as maps of wind shear coefficient, turbulence and vertical inflow angle. This enables efficient wind resource assessment, initial layout optimization and site suitability assessment. - Optimized design of field measurement campaign
The ME-WAM results may also be used for optimization of measurement campaign to confirm the predicted results. - Proven track-record
Modern Energy has conducted hundreds of numerical wind assessments for green-field, market analysis or for verification of full analyses with on-site measurements.
Model description
The numerical Wind Assessment Model (ME-WAM) predicts the local wind resource by combining high-resolution numerical weather simulations in the Weather Research and Forecasting Model (WRF), with microscale downscaling of the mesoscale flow field using WindSim.
The method only requires project coordinates as input, and produces wind resource maps at various heights, as well as maps of wind shear coefficient, turbulence and vertical inflow angle on a 16 x 16 sq. km surface covering the investigated site, see figure 2. This enables wind resource assessment, initial layout optimization and site suitability assessment.
For more information see methodology section.

Figure 1: Wind data from WRF (background map) is downscaled using WindSim (high resolution map) to achieve an accurate wind resource map for further analysis.
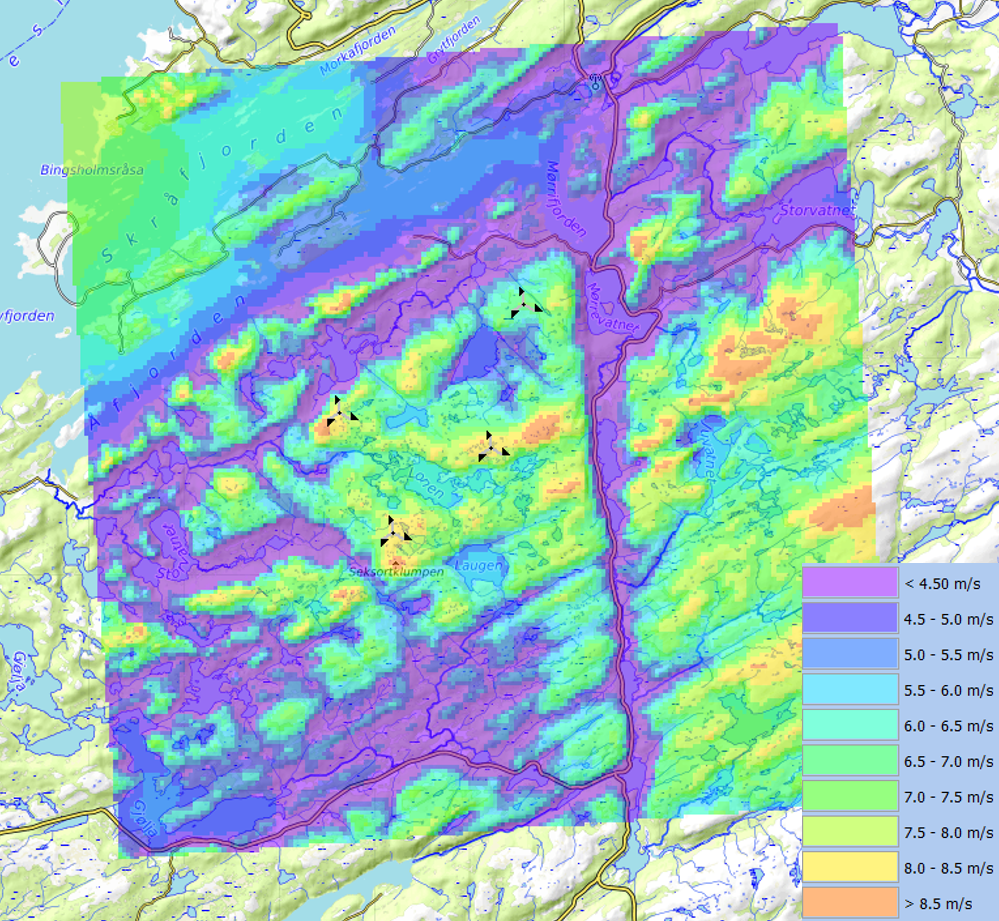
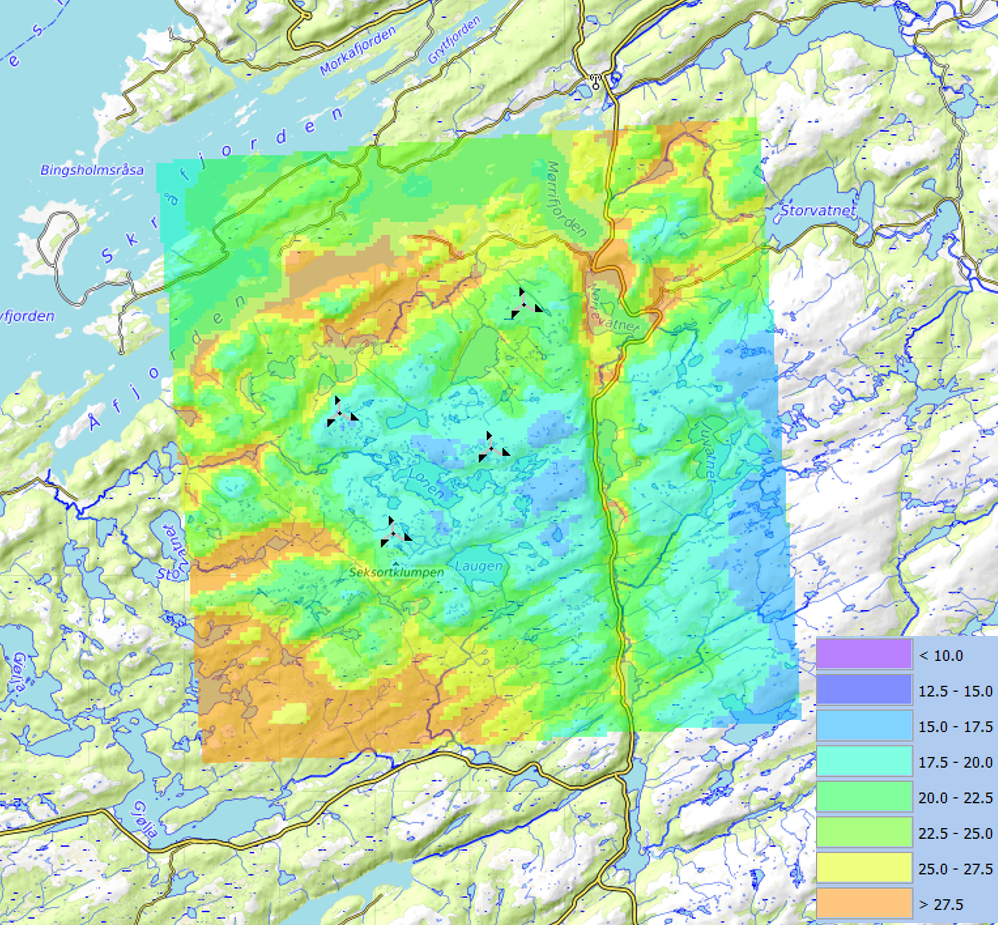

Figure 2: A wind resource map (left), turbulence map (middle) and wind-shear coefficient map (right) produced by our numerical method in complex terrain.
Model validation
We validated the method using data consisting of 80 meteorological masts located in complex terrain or forested areas. The average discrepancy between simulated and measured mean wind speed is below 0.1m/s, and the standard deviation is found to be below 0.3m/s. This represents an uncertainty of 4%. This is on par with that of a state-of-the-art pre-construction wind resource assessment with onsite measurements.


Figure 4: comparison of simulated wind speed (y- axis) and measured wind speed at the meteorological mast (x-axis).
Separately, we tested how well the method predicted the spatial distribution of mean wind speed. The method captures spatial variability without introducing biases due to microscale terrain. This validates that the method is suitable for layout optimization. In addition, we demonstrated that the turbulence and wind shear predictions are sufficiently accurate for initial analyses of turbine site suitability.
For more information see validation section or our public research paper in Wind Energy Science here.